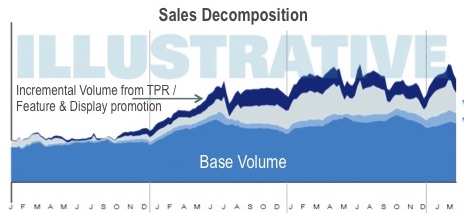
What is Marketing Mix Modeling ?
The mathematical framework to estimate direct and indirect effects of Marketing is called Marketing Mix Modeling. Often this framework is the Mathematical or Econometric Model for entire Ecosystem that includes 4 Ps of Marketing. 4Ps of marketing include Price, Place (Distribution), Promotion, Product. Seasonality and/or other macro economic indicators also directly or indirectly influence the Volume Sales.

To correctly model or estimate marketing mix, it requires a lot of key variables in the mathematical model. Dependent Variable is often Volume Sales or Market Share. Below are the Best Variables to build a Sales Response Model
Marketing Mix Modeling Variables
A robust marketing mix model or strategy that stands the test of time, involves a set of key actions. Those Actions or Variables are (and not limited to)
- Marketing activities
- Product Launches and Events
- Advertising – Mass Media (TV, Print, Radio, OOH etc)
- Promotions
- Distribution
- Product Pricing
- Cannibalisation due to multiple Product of the same Brand
- Digital Advertising- Search, Display, Video, Social Media
- Digital Campaigns
Base sales are Sales without any marketing activities and mainly driven by the Brand Equity.
Baseline Variables
Baseline Sales are achieved without any advertising. Brand Equity is a major contributor to the baseline . Baseline Variables are generally influenced by economic or environmental changes and remain generally stable.
- Base Sales: Weekly Volume Sales figures of the Product
- Base Price: Weekly Price of the product in the Market.
- Distribution: No. of stores/locations the product is available. It is of two types Numeric Distribution and Weighted Distribution. Distribution is one of the biggest contributors to baseline sales.
- Inventory orAssortment/SKUs: Number of SKUs in a store at weekly level (optional variable)
- Velocity: Rate at which product moves off the shelf in a store (optional variable)
- Seasonality Index: Dummy Variable to capture Spike/Dip in Sales
Promotions
- Temporary Price Reductions/Discounts: Sales that result from Reduction on Price of the Product
- Coupons/Offers (buy 1 get 1, buy 2, x% off): Sales that result from Coupons or Offers on Products on Shelf/Display
- Average Discount: Average Price Discount in a time period. Generally its weekly (Since Sales are weekly, so its better to capture it Weekly)
- Weighted Pricing Promotion: Average Price Discount on Products weighted based on their contribution to the weekly Sales.
Traditional Media and Digital Advertising Variables
Reach is defined as number of people exposed to the Ad. Frequency is defined as the Number of times Ad was run.
- TV GRP : Reach of the Ad * Frequency of the Ad (Number of Consumers reached by the ad)
- RADIO: Expenses on Radio or Reach of the Radio Ad (if such a metric is available, generally expenses are given). Modeling expenses is not the ideal way to capture such variables.
- OOH (Out of Home) : Expenses of the OOH Ad. Modeling expenses is not the ideal way to capture such variables. If there is a way that OOH impressions can be captured through Sensor or IOT technology, that would be better.
- PRINT : Weekly Expenses on Print Medium (Newspapers/Magazines etc.) or Circulation of the Editorial/Newspaper Frequency (Number of Consumers reached)
- SEARCH Impressions : Number of people reached/exposed to Search Ad
- DISPLAY Impressions : Number of people reached/exposed to Display Ad
- VIDEO/WebTV Impressions : Number of people reached/exposed to the Online Video Ads
- SOCIAL MEDIA Impressions : Number of people reached by Social Media Ad.
- SEARCH CTR (Click Through Rate) : Number of people who clicked on Search Ad
- DISPLAY CTR : Number of people who clicked on Display Ad
- VIDEO/WebTV CTR : Number of people who clicked on Video Ad
- SOCIAL MEDIA CTR : Number of people who clicked on Social Media Ad
- DIGITAL CAMPAIGN Impressions : Number of people who were exposed to the Online Campaign.
- DIGITAL CAMPAIGN CTR : Number of people who clicked on Online Campaign.
We can capture other digital variables as well like Video Completion Rate, Likes or others etc. But it is highly likely that they will be highly correlated which can introduce bias in the model. So either use one of them or combine them as a weighted average based on their affinity to Sales.
Competition Variables (all at Weekly level)
- Competition Media/Advertising Variables (if available)
- Promo Pricing Variables of the Competing Brands
- Distribution or Distribution Gains of the Competition
Other Variables (all at Weekly level)
- Category Growth (weekly)
- Product Launch/Big Events and Conferences- Expenses or Audience/Consumers reached
- Specific Product Promotions or Product Sampling- Sales Spike coming from specific Product Promotion or Free Sampling
- Sponsorships during Sporting or Cultural Events- Expenses or Audience Reached
- Trend Variables- Promo, Pricing or Distribution Trend in a Given Time Frame (either weekly, monthly, quarterly)
- Any other macroeconomic KPIs Available at a weekly level


